Embrace Holidays: Seasonal Analysis Tool
Texas alcohol sales are barely growing in 2025. June sales dropped 1.5% YoY. February was down 0.7%. The first half of 2025 shows minimal growth (+1.6% overall) compared to H1 2024. Chipotle's CEO is blaming "low consumer sentiment" for traffic declines. Cava's same-store sales growth collapsed from double-digits to 2.1%. Nearly 40% of U.S. restaurants saw sales decline in 2024. The consumer is tired.
When people are pulling back, you gotta mix it up. Give people a reason to come grab a beer or some dinner. Being good is not good enough, have to give people a reason to come out.
Monthly Sales as % of Annual Revenue (2024)
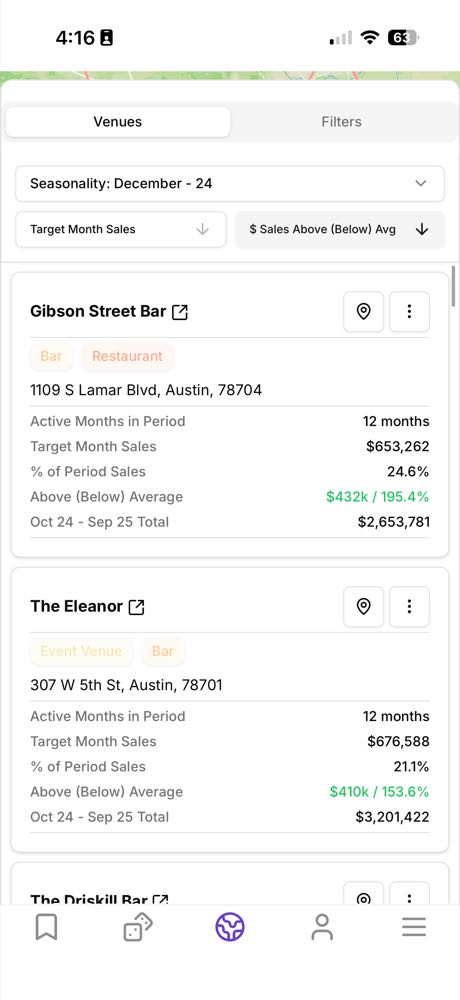
Notice how Gibson Street Bar sacrifices steady monthly distribution to dominate October & December
That's exactly why we built the seasonal analysis for Bar Savvy.
The Problem: Annual Metrics Hide the Game
Looking at annual or monthly sales doesn't tell you enough about how a venue 'gets' those sales $$, some venues really lean into the holidays and it completely changes their trajectory when you look at the full year. It doesn't tell you when money moves or who's capturing it, or how.
Case in point: Gibson Street Bar in Austin did $2.76M in 2024. Solid performance. But that annual number hides the real story:
Gibson Street generated $1.18M in just two months, 43% of their entire annual revenue by leaning hard into Halloween and Christmas. They do so well from October to December they could practically take the rest of the year off!
The Feature: See Who Wins Each Month
Our seasonal analysis feature shows each venue's monthly performance relative to their average. Click any month to see who dominates that month relative to how they do through out the rest of the year.
Why This Tool Exists
The old approach: Look at annual sales, maybe compare a few months manually, exit application.
The new reality: Click December. See exactly who crushed it, by how much, and start investigating why. Then do it for every month. Christmas cocktails in December, Haunted Houses in October, Beach Themed in July-August, or make your own holiday. Most importantly, see what works in other markets, see if there is something you can emulate in your own city.
The venues that lean into holidays & themes aren't just surviving, they are basically getting an extra month or two of revenue, squeezing 14 months of revenue into 12.
What's Next
This feature is live now on Bar Savvy. You can:
- Sort by any month to find seasonal leaders
- Filter by city, venue type, or receipt type
- Discover what works
We'll be releasing deep-dives on specific months (December holiday strategies, October Halloween tactics, March Spring Break playbooks) showing exactly what top performers are doing and how much they're making.
But the core insight is simple: annual numbers hide seasonal accelerators. In a tough market, you need to know when your competitors are winning and how much they're winning by.
Start Exploring Seasonal Performance
The seasonal analysis tool is available now on Mobile for Free Users for a limited time and available on desktop for paid subscribers only. Click any month to see who's dominating that window—then figure out how to capture your own seasonal spike.
All sales and data from Texas Alcohol Beverage Commission (2024).