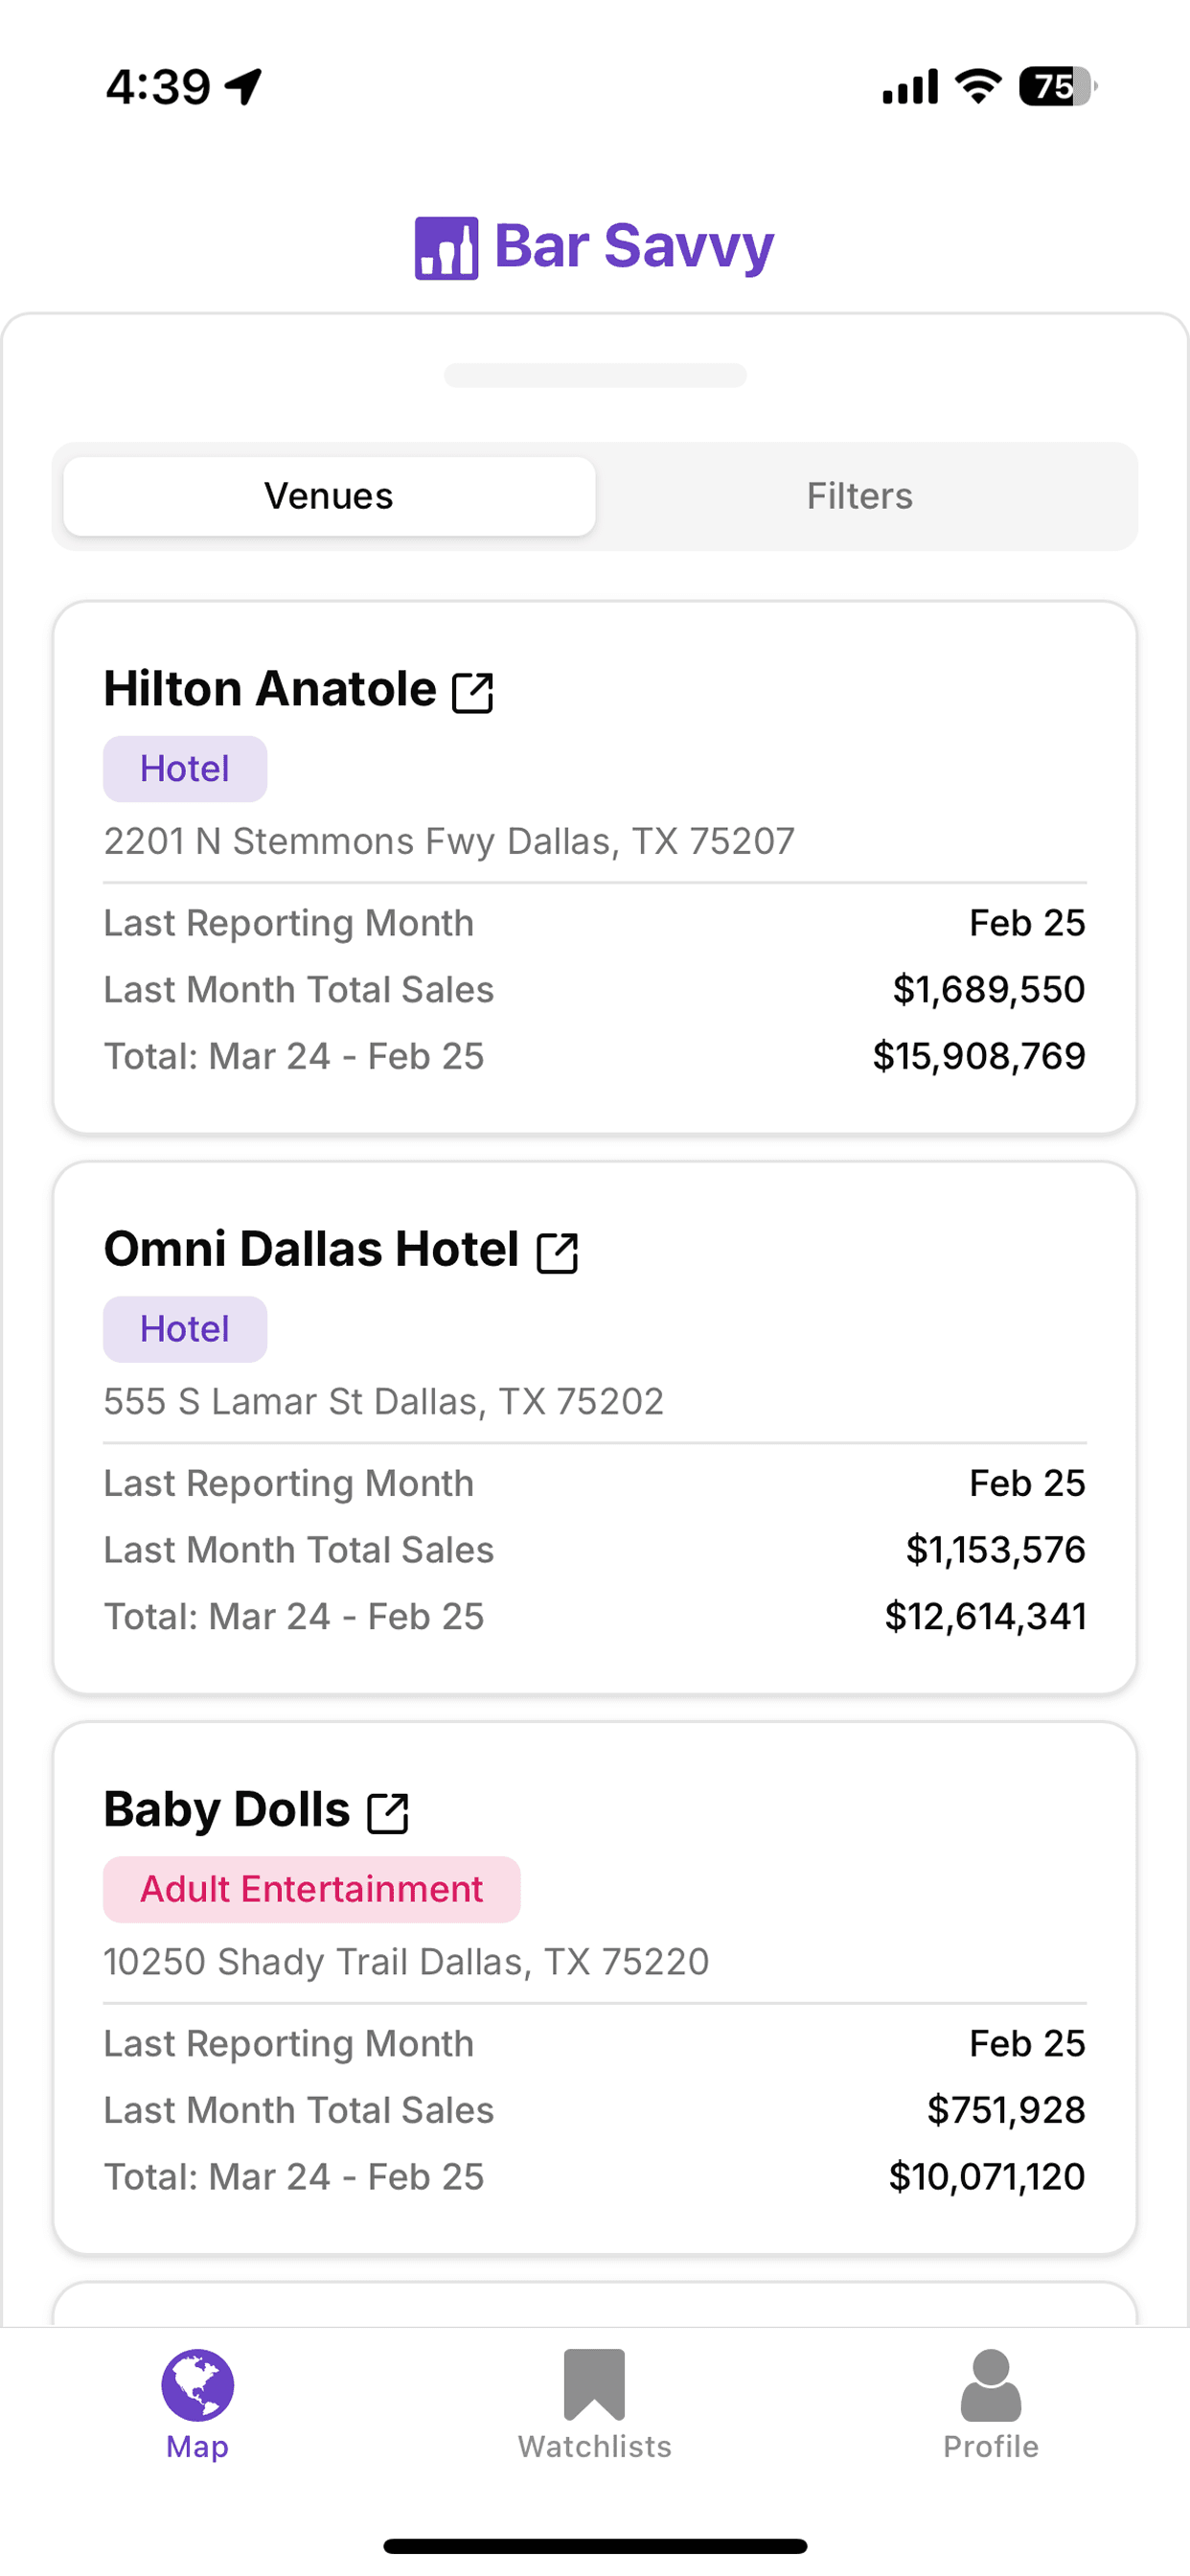
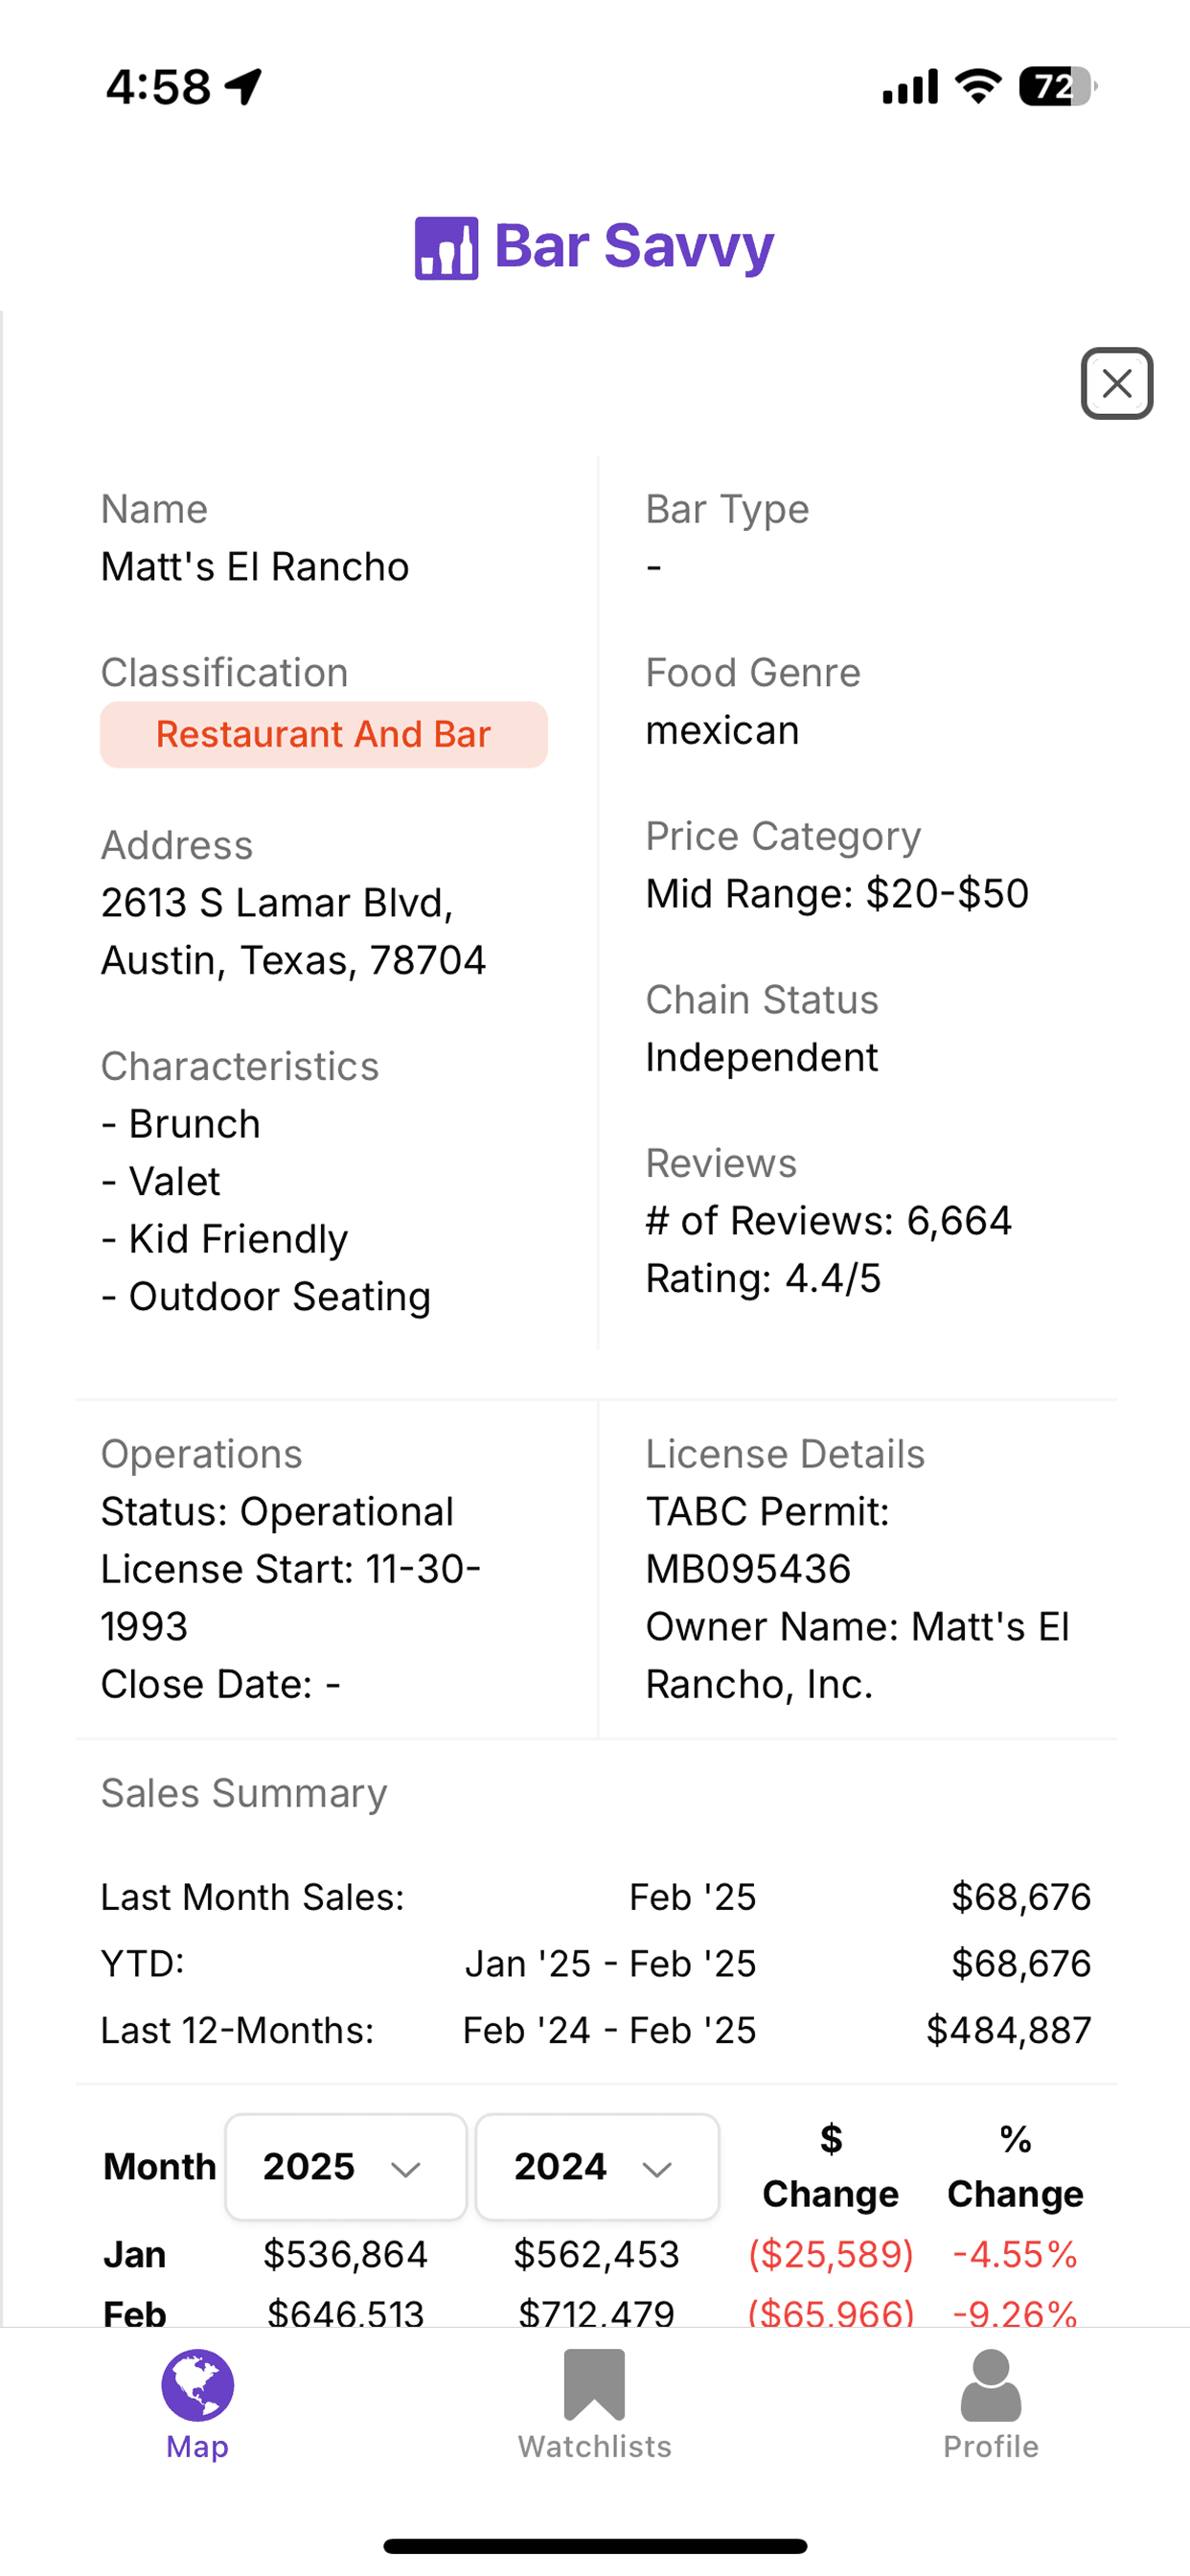
Alcohol Sales by Food Genre: 2024 Analysis
Detailed breakdown of alcohol sales performance across 9,665 Texas restaurants in 2024. Discover the best-performing food genres, top 10% benchmarks, business risk factors, and longevity trends.
Bar Savvy
We take TABC Receipts and turn them into actionable business intelligence by classifying and enriching every active venue with AI and publicly available data. Free tier available.
25,000+ Active Venues
Each venue is enriched with detailed metadata including business hours, price points, characteristics, and real-time performance metrics
Powerful custom search by chain, city, zip code, or venue name. Generate free liquor, beer, and wine sales revenue reports across Texas with our interactive map view.
Access comprehensive TABC data for every neighborhood
Rank alcohol sales data across Texas cities
Understand chain performance across the state
Evaluate the entire city
Find every venue in a neighborhood
Search by business name or license
Read our daily and weekly updates regarding interesting finds, macro trends, or tool releases.
Real venue sales data mapped across the state. Circle size adjust as a percentage of the total sales visible on the map. Whether you're searching for hotspots in Dallas or McAllen, you'll find the top performers and best geographies easily.
Find the highest-revenue venues and discover what's missing in underperforming markets.
Analyze performance by neighborhood, zip code, city, or street level to find market hotspots.
Bigger circles = higher revenue. Outliar concepts might have a secret sauce worth copy in your neighborhood.
Free liquor, beer, and wine sales revenue analytics across 17,000+ Texas establishments. Accurate Texas alcohol revenues with month-over-month variance tracking.
Texas bar sales, restaurant sales, and hotel sales data sourced from active TABC license holders. Median sales calculations exclude venues with zero reported sales to provide accurate market insights for Texas hospitality industry analysis.
Generate subscription-based TABC data dashboard reports with month-over-month variance analysis. Export custom alcohol sales reports directly to Excel for deeper insights.
Year-over-year sales growth tracking
Perfect for identifying fast-growing venues and market trends
Name | Main Class | 2024 Sales | 2023 Sales | $ Change | % Change |
---|---|---|---|---|---|
Hyatt Regency Hill Country Resort | Hotel | $6,722,438 | $5,236,053 | $1,486,385 | 28.39% |
Pullman Market | Restaurant/Bar | $2,975,989 | $0 | $2,975,989 | New Venue |
HangTime Bar & Patio | Bar/Nightclub | $1,452,419 | $125,687 | $1,326,732 | 1,055.58% |
Key Insight: Hyatt Regency Hill Country Resort increased sales by $1.5M (28%) with full-year operations
All views export directly to formatted Excel files
Always current with latest TABC sales figures
Complete coverage of Texas establishments
Pre-calculated insights for faster decisions
Access all our powerful features right from your phone, on both iOS and Android.
Explore our hand-picked collections of the highest-performing venues across Texas, updated monthly with the latest sales data.
Access all data views, create custom reports, and export unlimited datasets
Start Free Trial